Exploring TradePwner: A Comprehensive Market Trading Simulator
Mar 1, 2024 - ⧖ 11.0 minTradePwner is a powerful trading strategy simulator built entirely in Rust, designed to help traders backtest and optimize trading strategies across multiple markets. TradePwner is programming in Rust, and uses egui for its user interface. In this post, we'll take a look at the key features of the simulator and its detailed simulation results page, while highlighting some of the architecture that powers this application.
Chart
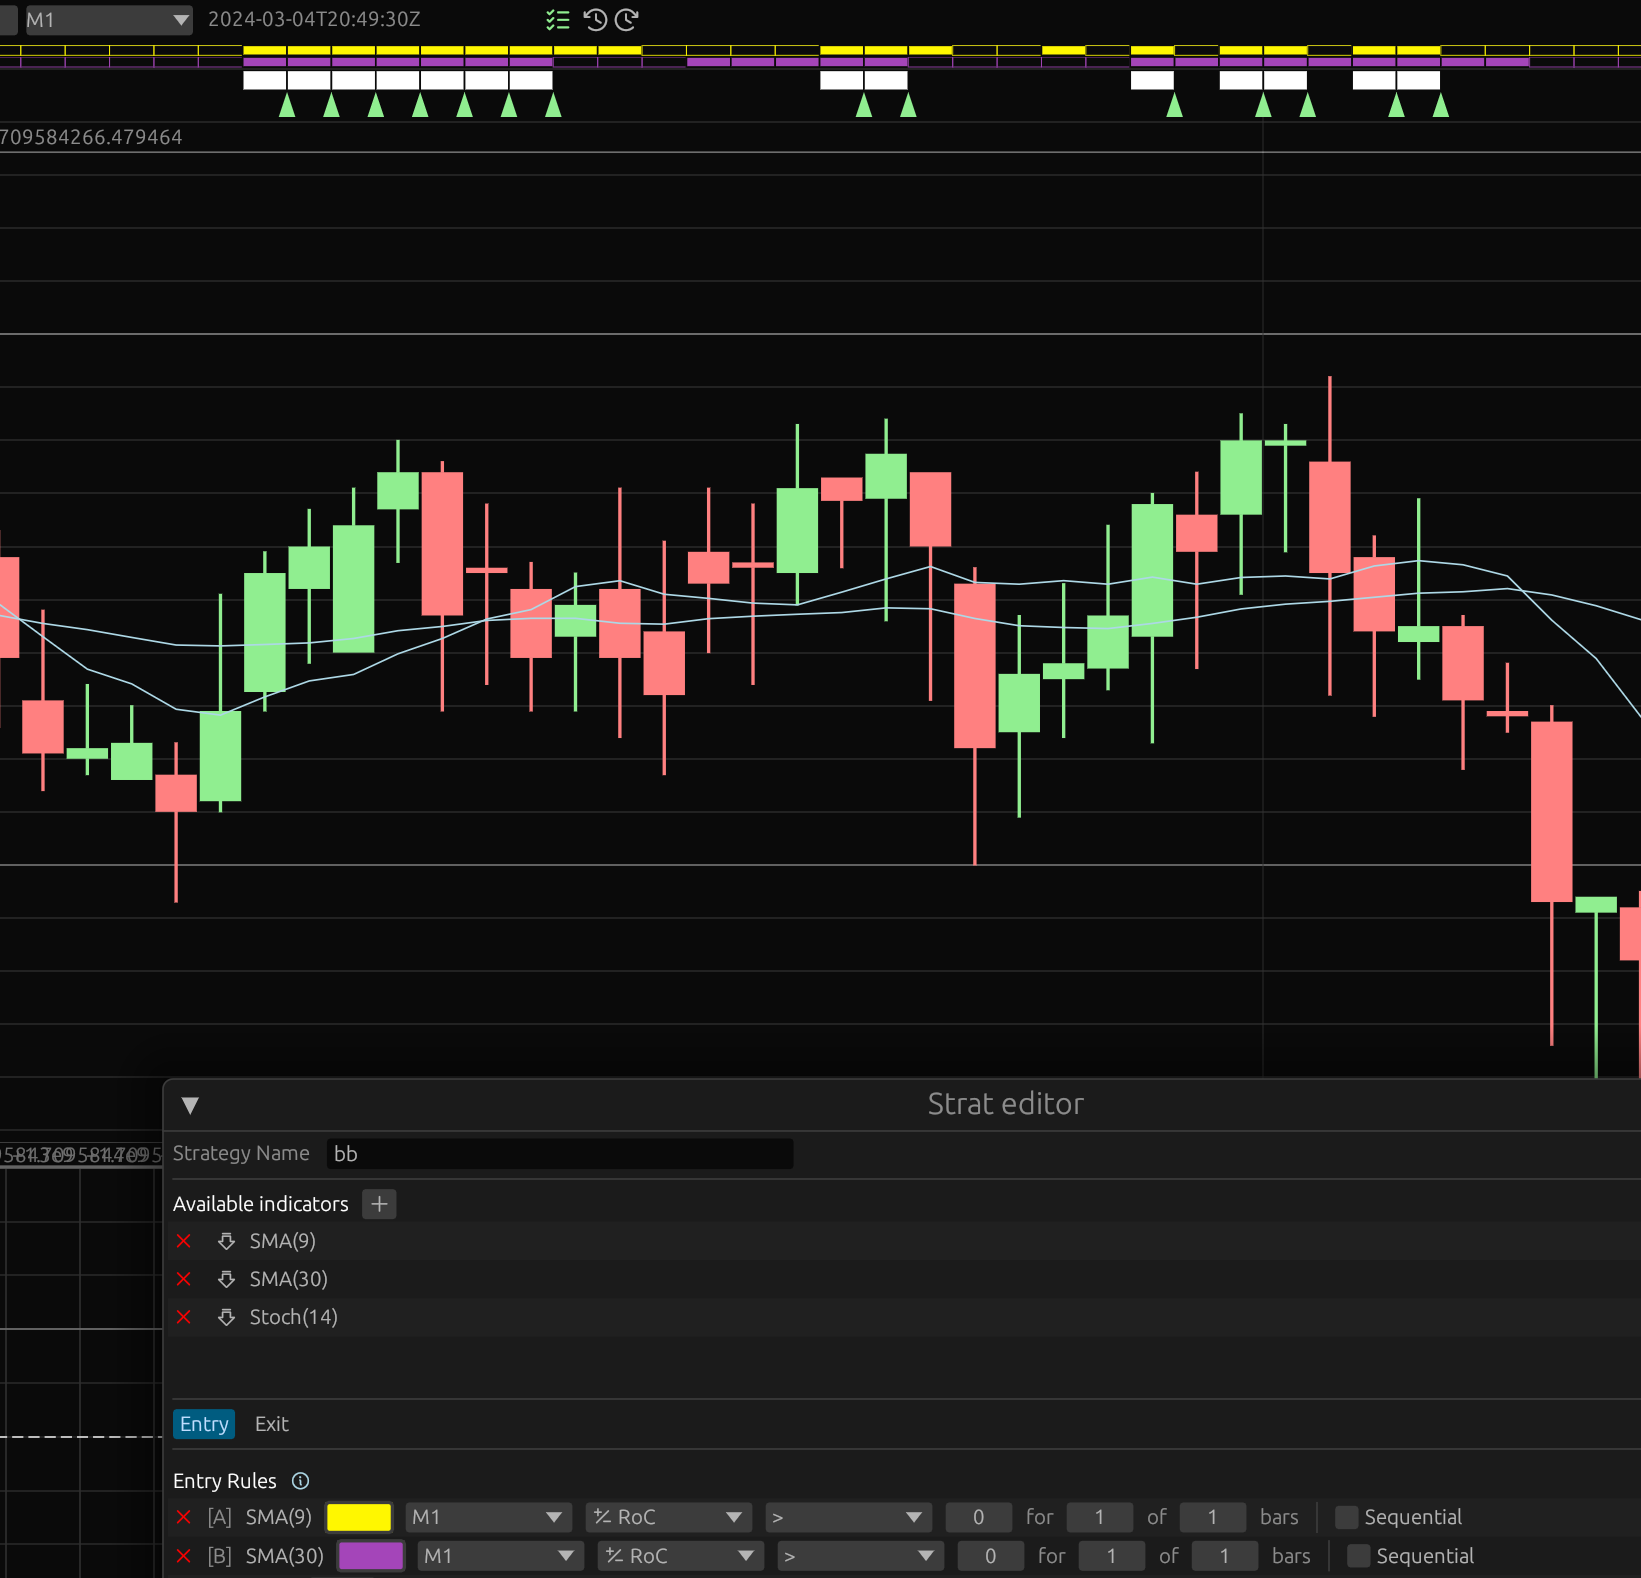
The chart uses OHLC bars for display with optional indicators. Indicators are added by right-clicking the chart and selecting an indicator. Each indicator has customizable options which update in real-time on the chart.
Support for these types of indicator drawings are available, which cover a large proportion of indicator types:
- lines
- symbols
- candles
A unique feature of the chart is that it allows multiple time periods to be displayed on a single chart. Bars can be drawn at various resolutions which allows you to see price action for multiple periods at the same time, making it easier to perform chart analysis.
Strategy Editor
The strategy editor allows creating a trading strategy using dropdowns and other UI elements. When the user adjusts any part of a strategy, the configuration is automatically saved and the visualizer will update. Major components of the strategy editor include:
- Strategy name
- Indicator selection
- Entry & exit rules
- Action selection
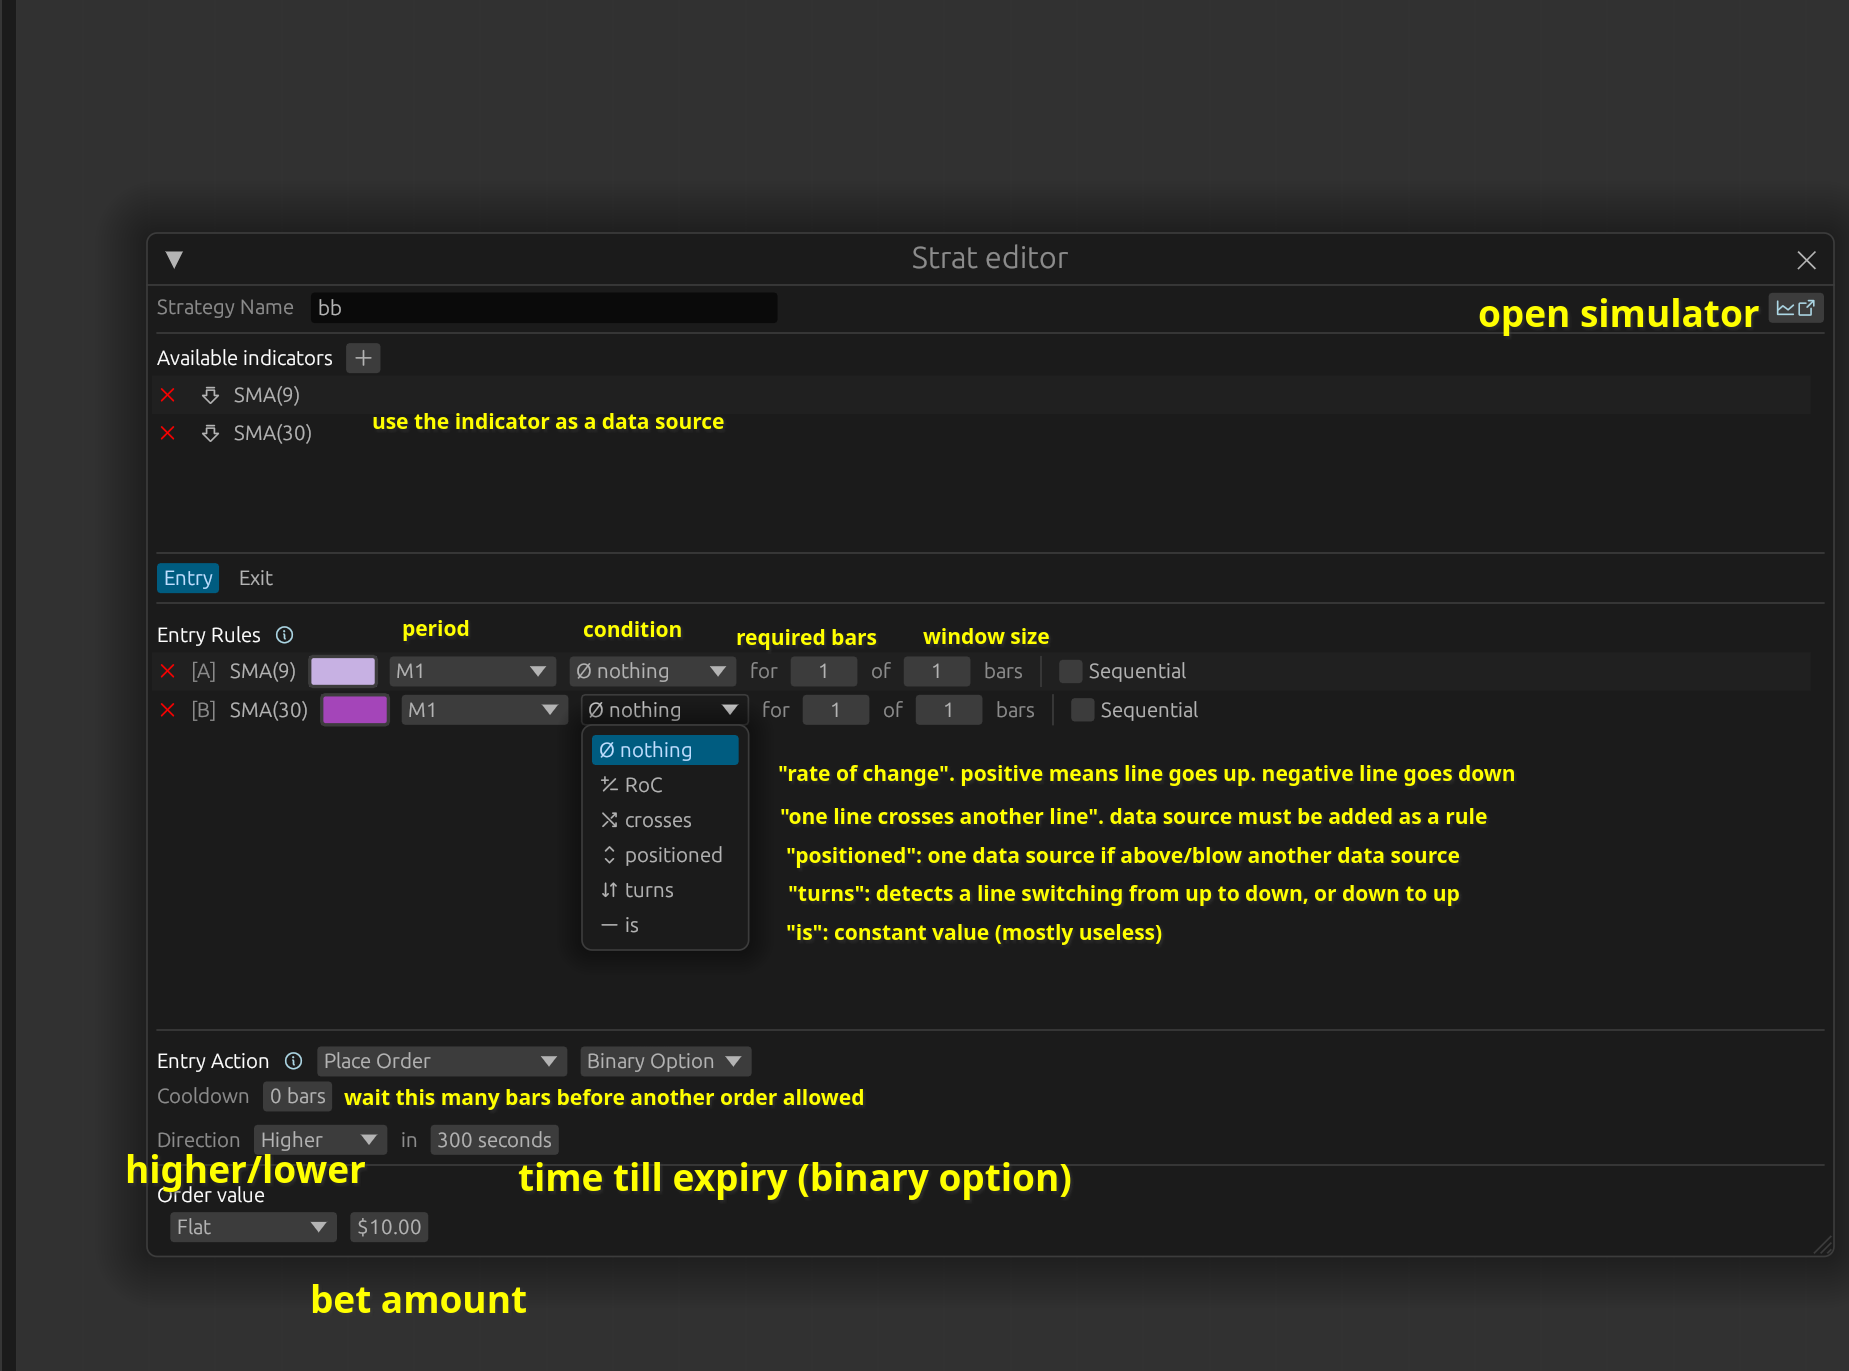
Entry and exit rules are where the strategy is implemented. Each rule is associated with a specific indicator. The indicator's output data is sent as an input to the rule, which allows the rule to trigger under the user-specified conditions. Additionally, all of the indicator output data is shared across the entire strategy, allowing rules to interact with each other.
Here are the rule options:
-
Which period to use (strategies can run on multiple time periods at once)
-
A trigger condition. Each trigger condition has trigger-specific parameters to set after selecting a specific trigger:
- Rate of Change: Triggers when the RoC meets a specific threshold.
- Crosses: Triggers when this indicator data crosses another indicator data, or crosses a set value, or OHLC chart data (like the high or low).
- Positioned: Triggers when this indicator data is above or below another indicator data, or a set value, or OHLC chart data (like the high or low).
-
Required Bars: The number of bars where this trigger must be active before a trade can be initiated
-
Window: How large the search window is for the required bars
-
Sequential: When checked, requires that the required bars occur sequentially within the window.
Finally, there is the action that can be taken when the strategy rules are fulfilled:
- Place order (immediate, delayed)
- Cancel order
- Cooldown: Require the specified number of bars to elapse before trading is allowed again.
While the strategy editor doesn't cover all possible use-cases, it does cover a wide variety of potential strategies.
Strategy Visualizer
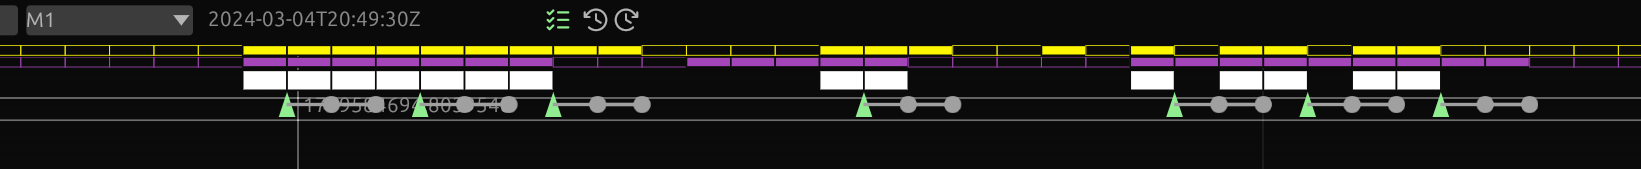
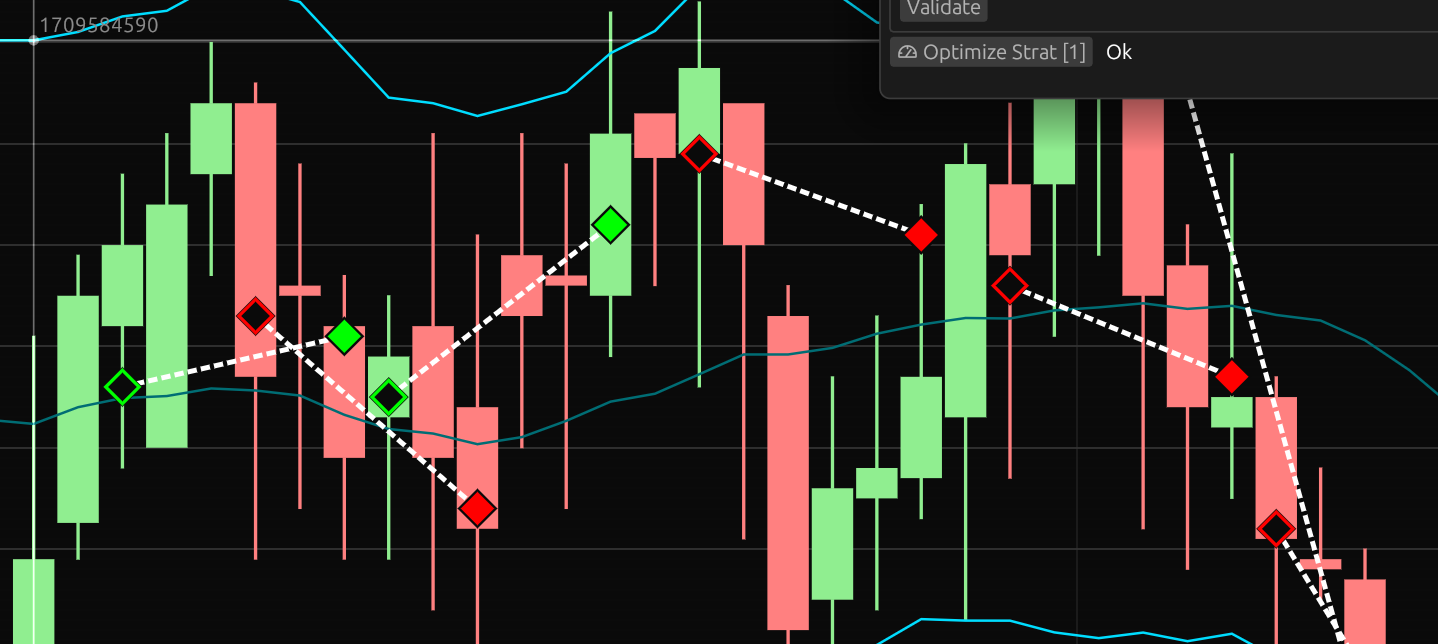
The strategy visualizer uses a novel on-chart implementation to visualize strategy rules in real-time. The color assigned to the rule in the strategy editor is shown at the top of the chart above each bar as a rectangle:
- A filled rectangle means the rule is active
- An outlined rectangle means the rule is inactive
This allows traders to see exactly which rules are applied at any given time in order to fine-tune their strategy which makes it easy to learn how a strategy rule will be applied when trading. Other visual markers include:
- "All rules active" marker: This is a white rectangle that means for the specific bar, every strategy rule has been fulfilled.
- Entry points: Where a trade will be taken
- Cooldown periods: how long to wait (in bars) before a new trade can be executed
Market Simulator
The market simulator has these options:
- Market type: Forex, Crypto, Binary Options
- Starting funds
- Symbols to simulate
- Interval selection
- Simulation resolution
In addition to running a simulation on the given time period, the market simulation window will run a real-time mini-sim as you tweak strategy parameters. This is a limited test run over a smaller period that gives a rough idea of how a strategy may perform. Regardless of simulation source, the chart will be marked with trade entry and exit points for immediate visualization of when and where trades occurred. A white dashed line connects red markers for losses and green markers for wins.
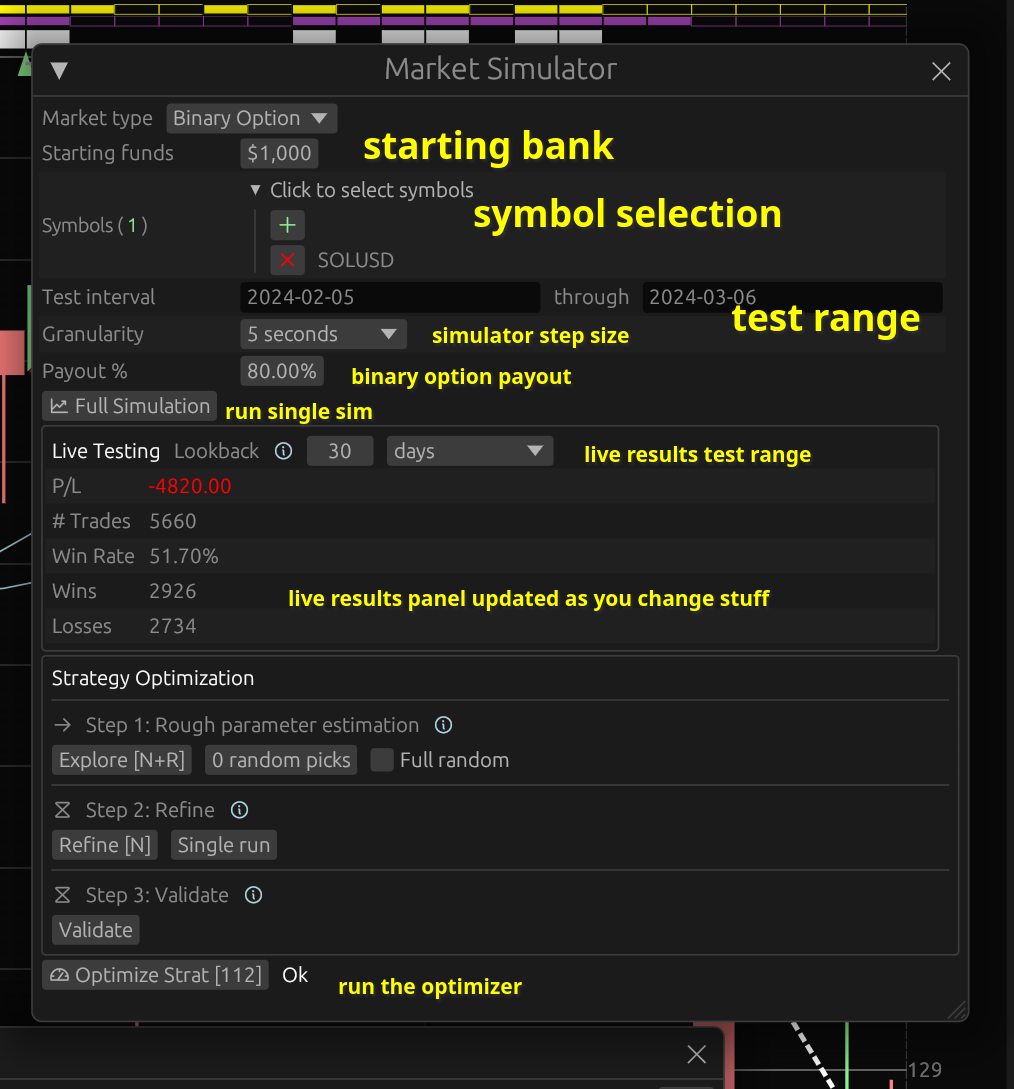
Optimizer
The optimizer occupies the bottom-half of the market simulator window. It uses a 3-step optimization procedure:
- Rough parameter estimation: Runs the strategy using coarsely-adjusted parameters to hone in on potential winning strategies.
- Parameter refinement: Once the target parameters are selected, the optimizer will make fine-grained steps during simulation.
- Validation: Finally, a forward-test on the final set of parameters is performed to confirm if the strategy was successful.
After the optimization run is complete, a web link will appear in the simulator window with the optimizer results. The page includes information about the simulation such as:
- Start & end balance
- P/L (total, average per day) and %P/L
- Trade count
- Simulation data (time taken, number of bars)
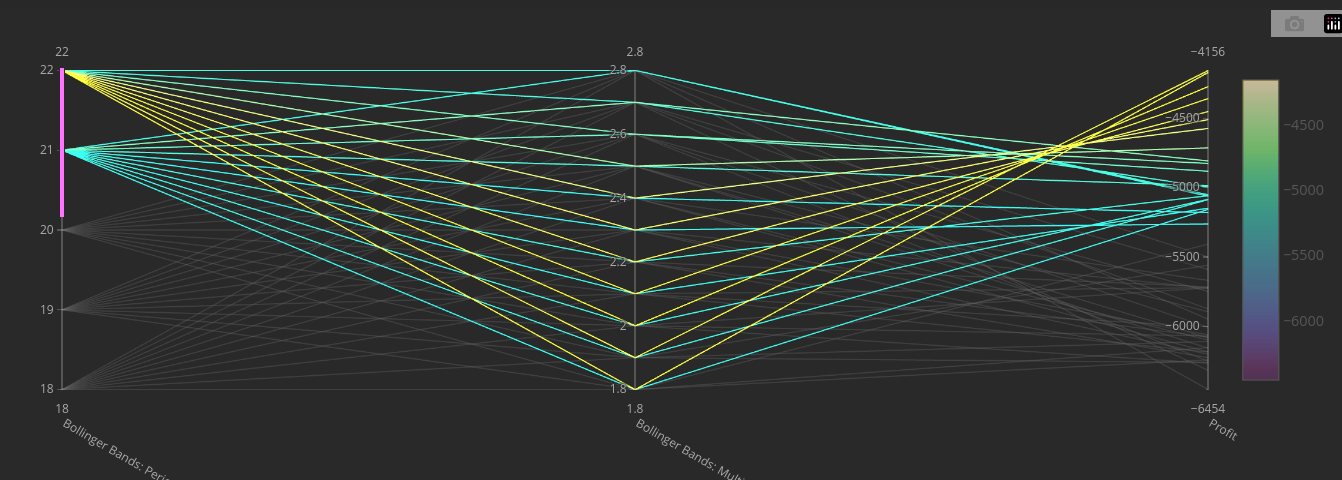
In addition, the optimization results include an interactive parallel-coordinates chart. Each rule in a strategy is represented by a single axis, with the total P/L on the final axis. This makes it easy to identify the exact parameters which resulted in the best P/L, along with avoiding potential over-fitting.
Indicators
Indicators are implemented in a modular way. There is an abstraction layer on top of the indicator implementation which allows them to integrate smoothly into the interface, chart, strategy editor, simulator, and optimizer. As a result, adding a new indicator automatically makes it work in all of the mentioned areas of the application.
Any number of indicators can be added to a chart, and the indicator outputs are drawn in real-time on the chart as parameters are adjusted.
User Experience
In addition to the features mentioned, there was also considerable thought put into the user experience. This includes:
- Theme Toggle: Light/dark mode support with automatic system preference detection
- Tooltips: Contextual help is available on mouseover for almost every button, menu, and interface element. These tooltips use rich formatting so they can display information in a readable manner.
- Live Updates: WebSocket integration for real-time report refreshing (except for optimization reports)
- Halt Button: An emergency stop button is available to terminate TradePwner's network access
- Performance: The chart runs at 60FPS in most cases. Zooming out to a large degree can drop some frames. But there is a cap to the zoom level to prevent this from getting out of hand.
- Element Placement: Shortcut buttons are placed in convenient locations. Like being able to open the market simulator straight from the strategy editor.
- Automatic Context Switching: Some actions will automatically cause different windows to popup. For example, if a password is required, the password window will pop up. If the network gets halted, then the network status window opens. Elements associated with application configuration options can open the configuration window directly and highlight the relevant options with a border.
Architecture
TradePwner's architecture consists of 50 distinct crates each contributing a small piece to the whole project. I won't go into detail about how it's all put together. But I'll list a few interesting crates below.
backbone
This is a statically-dispatched global service handle that hides generics at the callsite. I chose static for maximum speed and because I wanted object-safe traits so I could easily use associated types and additional generics. However, I've learned more about traits since creating this application and would definitely go straight to dynamic dispatch in the future. Below is how it works, and you'll see why it's not the greatest idea.
The goal is to use the below type with one generic everywhere in the program. This type cannot change because it would break basically everything:
// Handle to all application services.
# [ derive ( Clone , Debug )]
pub struct Backbone < H > {
pub handle : H ,
}
// Using it only requires one generic.
pub fn foo < B >( backbone : Backbone < B >)
where
B : BackboneServicesHandle {} HOWEVER, getting to one nice generic is painful:
// The trait to access a particular service.
pub trait BackboneServicesHandle : SendClone + std:: fmt:: Debug {
// Each of these is a trait to interface with a service
type EnclaveA : EnclaveApiShared ;
type EnclaveManagerA : EnclaveManagerShared ;
type RepoFactoryA : RepoFactoryShared ;
type StrategemaA : StrategemaApiShared ;
type WarpgateA : WarpgateApiShared ;
fn get (
& self ,
) -> & BackboneServices <
Self :: EnclaveA ,
Self :: EnclaveManagerA ,
Self :: RepoFactoryA ,
Self :: StrategemaA ,
Self :: WarpgateA ,
>;
} So, one associated type per service. This is kind of bad, but at least adding a completely new service isn't something that's done constantly so I can live with it. However, making this work with a nice Backbone<H> is just awful:
impl < EnclaveG , EnclaveManagerG , RepoFactoryG , StrategemaG , WarpgateG > BackboneServicesHandle
for BackboneServices < EnclaveG , EnclaveManagerG , RepoFactoryG , StrategemaG , WarpgateG >
where
EnclaveG : EnclaveApiShared + std:: fmt:: Debug ,
EnclaveManagerG : EnclaveManagerShared + std:: fmt:: Debug ,
RepoFactoryG : RepoFactoryShared + std:: fmt:: Debug ,
StrategemaG : StrategemaApiShared + std:: fmt:: Debug ,
WarpgateG : WarpgateApiShared + std:: fmt:: Debug ,
{
type EnclaveA = EnclaveG ;
type EnclaveManagerA = EnclaveManagerG ;
type RepoFactoryA = RepoFactoryG ;
type StrategemaA = StrategemaG ;
type WarpgateA = WarpgateG ;
fn get (
& self ,
) -> & BackboneServices <
Self :: EnclaveA ,
Self :: EnclaveManagerA ,
Self :: RepoFactoryA ,
Self :: StrategemaA ,
Self :: WarpgateA ,
> {
self
}
} So I wouldn't recommend ever doing this in a large application. Just go dyn and structure the code so it doesn't get called constantly. If you must call it constantly, then try one of these options instead:
- Use an
enumwith all possible options. I actually do this in part of the code anyway. - Move the data into the
dynand do one big operation on it. This only works if you actually have all the data though, so it's not always an option.
enclave
TradePwner can potentially integrate with platforms that have sensitive information. For this reason, the API keys are stored in an encrypted state on disk and need to be unlocked prior to use.
When starting TradePwner, the application can be used immediately without unlocking the enclave. As soon as the user attempts an operation that needs to use an API key, a password window will pop up asking for the user's password. This password is used to decrypt the API keys, and they will stay in-memory for the duration that TradePwner is running or until the user "locks" the application. Locking the application unloads the keys and the user will need to input their password again. This will also cause some network operations to start failing since they may need access to API keys.
warpgate
All of the network code is put into this crate. This made it trivial to implement the "emergency halt" button mentioned earlier.
In addition to a full "halt" (all network operations suspended), the network can also be in a "fault detected" state. This is a degraded state and usually means that TradePwner received an HTTP 429 "Too Many Requests". When this happens, warpgate automatically backs off.
To re-enable the network or view faults, the user can open the "network status" window which displays the status and recent network events.
sim00lator
This is the market simulation crate. To run a simulation, a "Preparation Artifact" is created. This contains all necessary information to run the sim.
In the artifact, the following actions are performed:
- A "Simulation Harness" is created. This contains everything needed for the sim.
- OHLCV data is loaded and flattened
- Strategy is loaded
- Each rule in the strategy is flattened into vectors
- The OHLCV vector and rule vectors are masked to produce a vector of entry and exit positions
- The harness spawns the simulator
- The simulator iterates the entry+exit position vector and tracks trades using a simulated account
- A report is generated and the simulator is destroyed
- The harness returns the report
This implementation enables easy multi-threading. Spawning a simulation harness is done on any thread and then it manages the entire process from there. Since optimizing requires running thousands of simulations, this architecture makes it easy to saturate all the CPU cores by spawning harnesses on all cores.
While my explanation of the overall steps is simple, the actual implementation is a bit complicated due to application of the strategy rules. I also discovered that allocating vectors is pretty expensive, so I had to do a bit of work to rework how data is managed so that some data can be shared to reduce vector allocation.
Conclusion
The tradeoff between static and dynamic dispatch in the backbone crate taught me lessons I carry into new Rust projects.
The strategy visualizer solved a real problem: seeing exactly when and why a trade would trigger. Before adding it, I spent too much time second-guessing whether my strategy rules were working correctly. Now traders can watch their rules light up on the chart and understand the logic behind every trade.
If you're interested in building something similar, modular architecture via workspaces would be a good starting point. I actually use this in almost all new projects, even ones that I know will be small in scope. Each crate has a narrow focus, which made testing and iteration faster, along with reducing compile times.